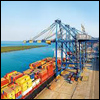
Continuing the good feat marking 7.9 per cent increase in March, seaborne traffic at the country’s 13 major ports increased 8.9 per cent in April. As many as 11 ports handled more freight during the month, with only New Mangalore and Kandla reporting y-o-y decline in business volume. New Mangalore had 9.5 per cent less business due to 13 per cent decline in POL and 10 per cent in thermal/coking coal and other general industrial cargo. The three per cent volume reduction in Kandla was due to 13 per cent drop in other general industrial cargo.
Among the 11 ports enjoying enhanced volume, V.O. Chidambaranar got 36 per cent more freight due to widespread improvement among the cargoes and Mumbai Port 31 per cent due to much better POL and other general industrial cargo. Mormugao, which was witnessing shrinking commerce in recent years, found its freight go up for the third consecutive month; business volume at the port increased by 23 per cent due to doubling of freight of other general industrial shipment.
Among the cargoes, fertiliser freight increased 25 per cent. Iron ore quantity handled at the ports rose 17 per cent, with Visakhapatnam posting 26 per cent increase in this freight. Thermal coal increased 14 per cent; this was largely at Kamararajar (Ennore) where it recorded 23 per cent increase.
Other general industrial cargo was up by 18 per cent; the rise was largely in Mumbai and Visakhapatnam (+35-36 per cent). POL, the largest category cargo by quantity, increased by 5.3 per cent, with Mumbai enjoying 24 per cent increase and Kandla and Paradip around 6 per cent enhancement, even as New Mangalore encountered 13 per cent y-o-y decline in the freight.
|
SEABORNE CARGO AT MAJOR PORTS DURING APRIL 2014
|
||
|
000 Tonnes
|
% Increase
|
|
| Kolkata Dock System |
1,051
|
21.78
|
| Haldia Dock Complex |
2,248
|
8.49
|
| Total: Kolkata |
3,299
|
12.40
|
| Paradip |
6,417
|
10.33
|
| Visakhapatnam |
5,015
|
7.09
|
| Ennore (Now Kamrajar) |
2,323
|
19.31
|
| Chennai |
4,397
|
3.07
|
| V.O. Chidambaranar (earlier Tuticorin) |
2,637
|
36.35
|
| Cochin |
1,779
|
13.89
|
| New Mangalore |
2,969
|
-9.54
|
| Mormugao |
1,119
|
23.24
|
| Mumbai |
5,055
|
31.23
|
| JNPT |
5,423
|
4.47
|
| Kandla |
6,941
|
-2.58
|
| Total |
47,374
|
8.90
|
| Classification by cargo | ||
| POL |
15,911
|
5.32
|
| Iron ore |
2,261
|
16.79
|
| Finished fertiliser |
530
|
45.21
|
| Raw fertiliser |
600
|
12.15
|
| Coking coal |
2,850
|
-6.50
|
| Containers |
9,718
|
5.54
|
| Other cargo |
9,132
|
18.44
|
| Total |
47,374
|
8.90
|


