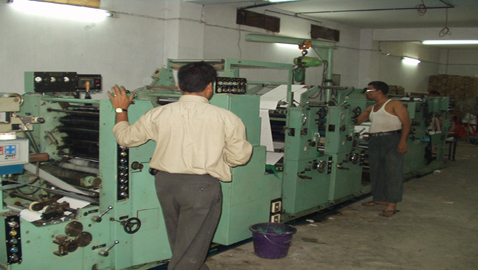
Factory output increased 1.7 per cent during December, half the pace in the previous month, even as the rate was better than stagnation during this month a year ago. Manufacturing expanded 2.1 per cent and electricity 4.8 per cent, but mining eroded 3.2 per cent annually over the month. Capital goods index increased 4.1 per cent against 2.5 per cent decline in this month a year ago. Consumer non-durables increased 5.7 per cent (2.8 per cent); however, consumer durables remained in the negative zone. Basic goods (2.4 per cent) and intermediate goods (0.1 percent) indicated deterioration, relative to the feat in December 2013.
Taking the cumulative data that would even out month-to-month volatility, improvement in industrial production, though subdued, is evident. Total factory production index showed 2.1 per cent (0.1 per cent) increase during April-December period. Manufacturing expanded 1.2 per cent (decline of 0.4 per cent) and mining 1.7 per cent (decline of 1.5 per cent). Electricity rose 10 per cent, twice the rate in the comparable period a year ago. In mining, coal production increased 9.1 per cent, six times the pace during April-December 2013-14; the decline in crude oil and natural gas has got reduced.
In manufacturing, five out of 22 major industries (at two-digit NIC levels) declined y-o-y during the first three quarters of the ongoing fiscal. The steepest decline of 55 per cent was recorded in radio, TV and communication equipment. Electrical machinery recorded 19 per cent increase, basic metals 11 per cent and other non-metallic mineral products 5 per cent. Transport equipment increased 9 per cent. The growth rate in wearing apparel, dressing material etc. worked out to 18 per cent during December, against 20 per cent in November and 10 per cent in October. Refinery production increased 0.2 per cent during April-December.
In use-based classification, basic goods index increased 7 per cent during the first nine months of ongoing fiscal, against 1.5 per cent during the corresponding period of 2013-14. Capital goods that cater to project investment increased 4.8 per cent (decline of 0.4 per cent). Among the other material inputs in project execution, cement production increased 7.9 per cent, twice the rate in the similar period in 2013-14, whereas alloy-non-alloy steel production retarded from 11.5 per cent to 1.6 per cent. Intermediate goods increased 1.7 per cent (3.1 per cent) and consumer non-durables 2.2 per cent (5.8 per cent). Consumer durables, which include scooters, cars, gems and jewellery etc., sank deeper in red.
|
INDEX OF INDUSTRIAL PRODUCTION (Y-O-Y % INCREASE)
|
||||
|
|
December
|
April-December
|
||
|
|
2013
|
2014
|
2013-14
|
2014-15
|
| Mining | 2.6 | -3.2 | -1.5 | 1.7 |
| Manufacturing | -1.1 | 2.1 | -0.4 | 1.2 |
| Electricity | 7.5 | 4.8 | 5.6 | 10 |
| Overall IIP | 0.1 | 1.7 | 0.1 | 2.1 |
| Use-based classification | ||||
| Basic goods | 3 | 2.4 | 1.5 | 6.9 |
| Capital goods | -2.5 | 4.1 | -0.4 | 4.8 |
| Intermediate goods | 5.2 | 0.1 | 3.1 | 1.7 |
| Consumer goods | -4.6 | 0.7 | -2.9 | -4.9 |
| Consumer durables | -16.4 | -9 | -12.9 | -15.2 |
| Consumer non-durables | 2.8 | 5.7 | 5.8 | 2.2 |


