
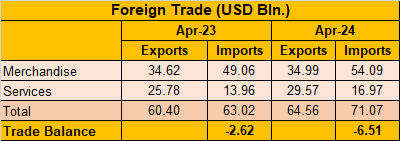
India’s export performance in April 2024 reveals a robust trajectory, with the combined exports of merchandise and services reaching an estimated USD 64.56 billion, marking a 6.88 percent growth compared to April 2023. Imports, on the other hand, surged to USD 71.07 billion, reflecting a significant 12.78 percent increase over the previous year.
Merchandise Trade
The merchandise export sector experienced a modest rise, registering USD 34.99 billion in April 2024 against USD 34.62 billion in April 2023. Imports in this category saw a more pronounced leap, amounting to USD 54.09 billion compared to USD 49.06 billion in the same period last year.
When excluding petroleum and gems & jewellery, non-petroleum and non-gems & jewellery exports stood at USD 26.11 billion, a slight uptick from USD 25.77 billion in April 2023. Correspondingly, non-petroleum, non-gems & jewellery imports totaled USD 32.72 billion, marginally higher than the USD 32.13 billion recorded the previous year.
Notably, 13 out of 30 key merchandise export sectors exhibited growth in April 2024 compared to April 2023. The sectors with remarkable performance included Electronic Goods (25.8 percent), Tea (25.74 percent), Organic & Inorganic Chemicals (16.75 percent), Coffee (15.87 percent), and Tobacco (13.22 percent). Additionally, sectors such as Spices (12.27 percent), Drugs & Pharmaceuticals (7.36 percent), Cotton Yarn/Handloom Products (6.65 percent), Carpets (5.64 percent), Cereal Preparations & Miscellaneous Processed Items (5.33 percent), Petroleum Products (3.1 percent), Plastic & Linoleum (2.99 percent), and Handicrafts (2.36 percent) also recorded positive growth.
Conversely, merchandise imports faced a contraction in 14 of the 30 key sectors. Significant declines were observed in Sulphur & Unroasted Iron Pyrites (-71.75 percent), Pearls, Precious & Semi-Precious Stones (-21.12 percent), Cotton Raw & Waste (-16.31 percent), Wood & Wood Products (-14.11 percent), and Coal, Coke & Briquettes (-11.71 percent). Other sectors experiencing negative growth included Artificial Resins & Plastic Materials (-10.26 percent), Fertilisers (-8.3 percent), Iron & Steel (-8.28 percent), Chemical Material & Products (-7.69 percent), Organic & Inorganic Chemicals (-5.19 percent), Machinery (Electrical & Non-Electrical) (-3.54 percent), Dyeing/Colouring Materials (-2.63 percent), Pulp and Waste Paper (-2.2 percent), and Transport Equipment (-0.22 percent).
Services Trade
The services sector exhibited robust growth with exports reaching USD 29.57 billion in April 2024, up from USD 25.78 billion in April 2023. Service imports also saw an uptick, climbing to USD 16.97 billion compared to USD 13.96 billion in the same period last year.


